
How much new revenue does your business generate for every dollar you spend? (SaaS Metrics)


When I started studying Product Management (PM), I realized that there are existing fundamental metrics and principles that guide us through our journey, ensuring that we are on the right path and helping us to know: For every dollar spent, how much new revenue does that bring in?
Whether you have an idea and seek to assess its feasibility or need to understand whether you are charging the right amount for your product, the following lines will guide you through the process from the beginning.
To help you understand my calculations, I share, on ths link, a spreadsheet with all the calculations. I challenge you to change the "Monthly fee" value or the "annual increment" of new customers and see how small changes have so much impact.
HIGH LEVERAGE BUSINESS
What is a high-leverage business?
A high-leverage business model in the context of Software as a Service (SaaS) refers to a model that efficiently and effectively scales its operations, resources, and revenue without proportional cost increases. It often manifests in four main key aspects: Scalability, Automation, a Subscription-Based Revenue Model, and Customer Retention.
If you are considering building a new business, search for how to calculate the TAM (Total Addressable Market) and check if your idea is a "High Leverage Business." TAM represents the maximum opportunity for a product or service within a defined market. In other words, a business could capture the total revenue potential if it achieves 100% market share in a specific service or sector. TAM is a valuable indicator for anticipating business growth and is a vital analysis for investors seeking startup growth.
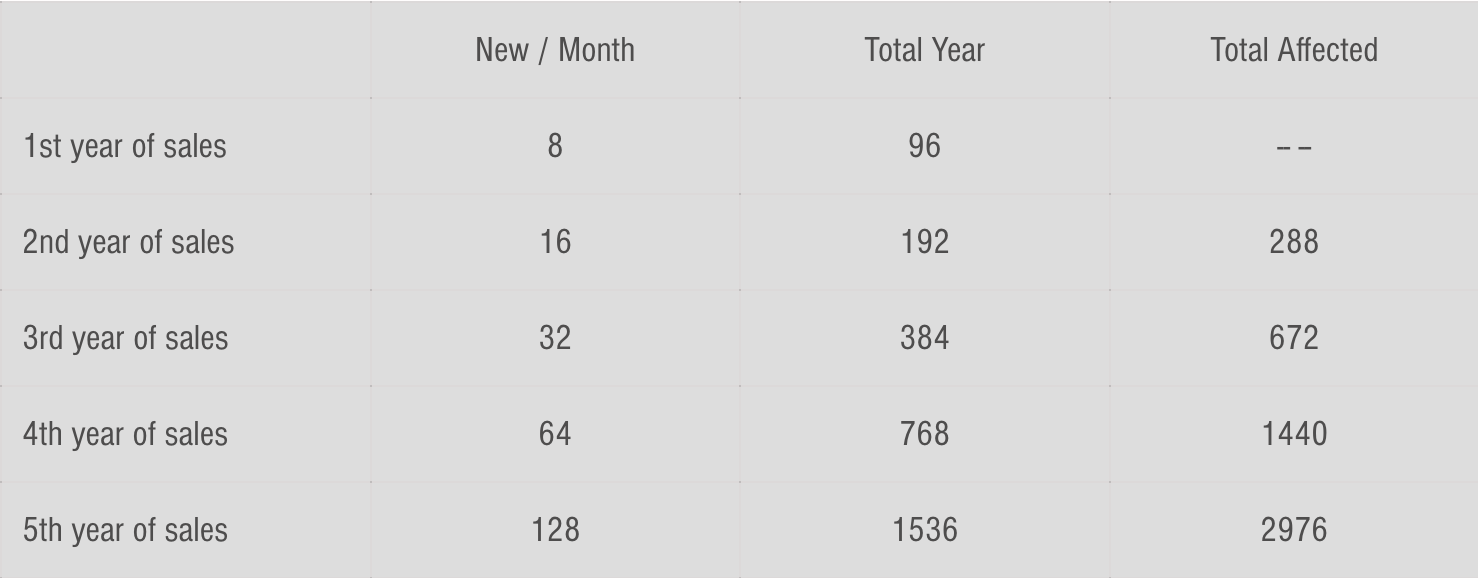
Let's simulate a startup scenario, starting with an average of 8 new customers monthly for the initial year and an exponential increase of 2 in the subsequent years, and see the projection over the next five years.
CUSTOMER ACQUISITION COST (CAC)
The expense of acquiring a new customer includes marketing, sales, and related costs.
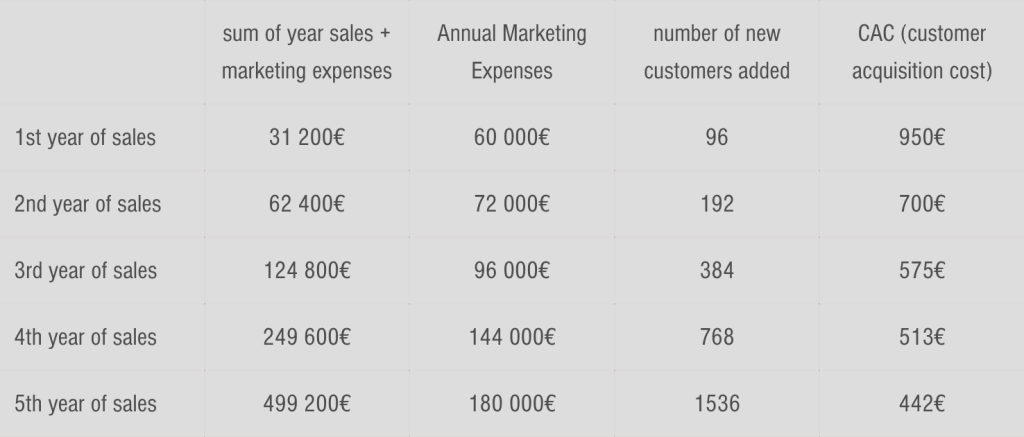
CAC= (sum of year sales + marketing expenses) / number of new customers added
For example, for the first year, based on a 50€ monthly fee
CAC= (31 200€ + 60 000€) / 96
If you need to understand how I achieved this value of 31 200€ for the "sum of year sales," check the spreadsheet on the link above.
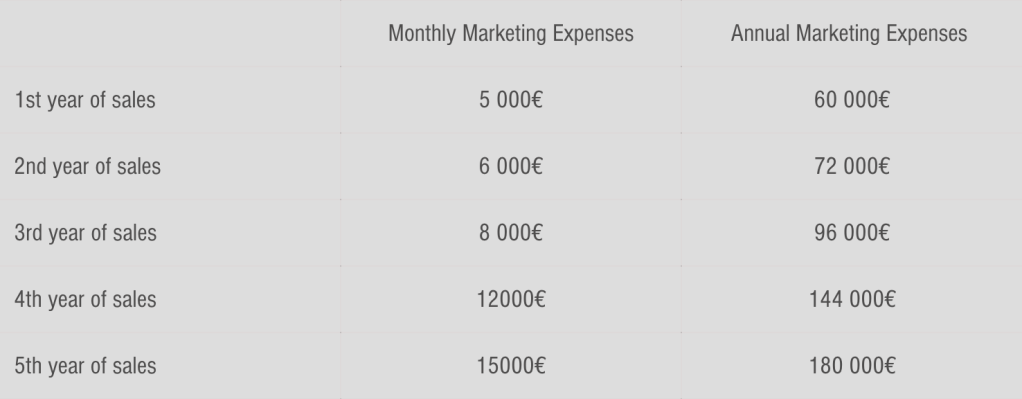
For the charts shown, I allocated low values for marketing across five years. While this is a conservative estimate for two marketers, content creation and some ads, it's just one example. Monthly variations are expected, and you certainly increase and adapt the marketing expenses more accurately while growing sales and the number of customers you address.
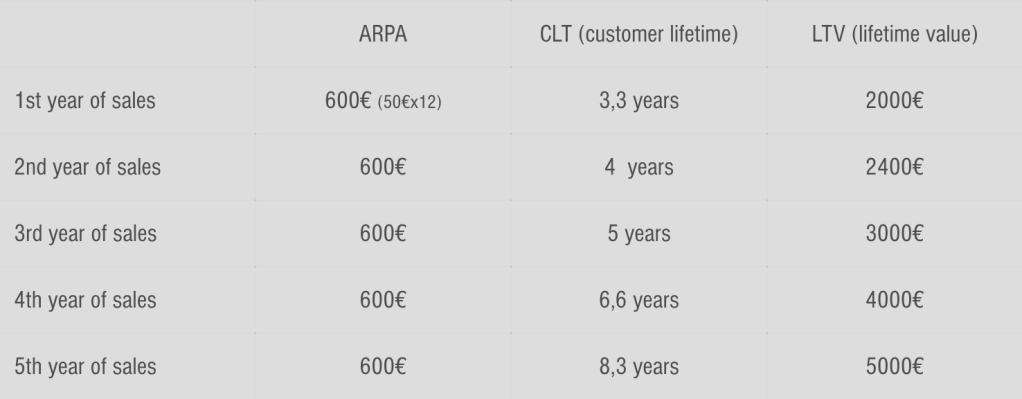
CUSTOMER LIFETIME (CLT)
The entire duration a customer remains engaged with your product or service (If you started your calculations based on years, keep it)
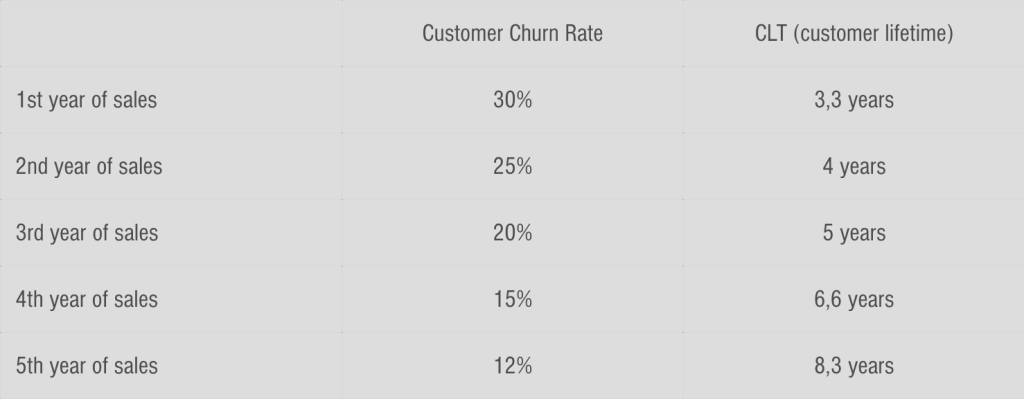
CLT = 1 / Customer Churn Rate
Customer Churn Rate: The percentage of customers discontinuing a service or product during a year.
Example: CLT = 1 / 20% (year) = 5 years
LIFETIME VALUE (LTV)
Total revenue anticipated from a customer throughout their entire engagement with a business or service.
In a situation where all customers have the same ARPA and where there is no expansion revenue expected over the lifetime of a customer, you can use this simple formula:
LTV = ARPA x CLT
ARPA is the average MRR per account. (MRR - monthly recurring revenue)
Once again, if ARPA is yearly, the churn rate should be yearly.
LIFETIME / CUSTOMER ACQUISITION RATIO
The Lifetime Value to Customer Acquisition Cost (LTV/CAC) ratio compares the expected revenue generated from a customer over their lifetime to the cost of acquiring that customer. It is a crucial indicator in assessing the effectiveness and profitability of a business's customer acquisition efforts. A higher LTV/CAC ratio is generally considered favorable, suggesting that the lifetime value of customers exceeds the cost incurred to acquire them. This ratio is crucial for evaluating a business's long-term sustainability and success.
Ratio = LTV / CAC
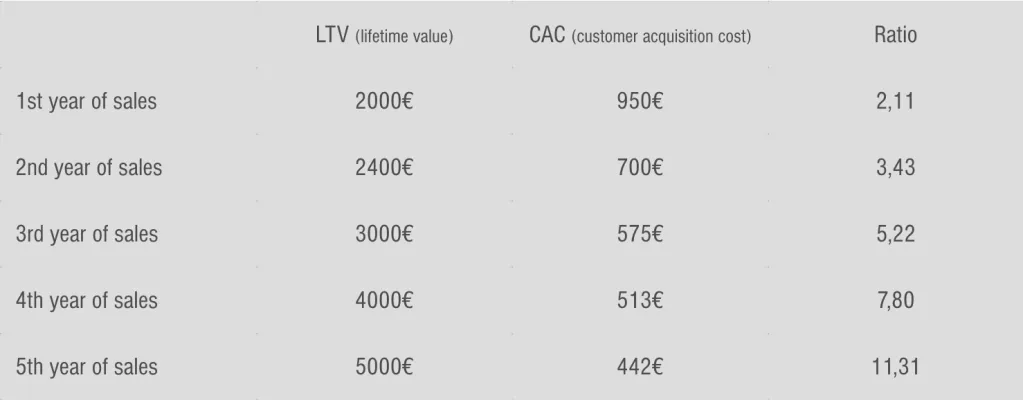
The guideline for a successful online business is that the ratio should exceed 3.
MONTHS TO RECOVER CAC
CAC / ARPA = Months to recover
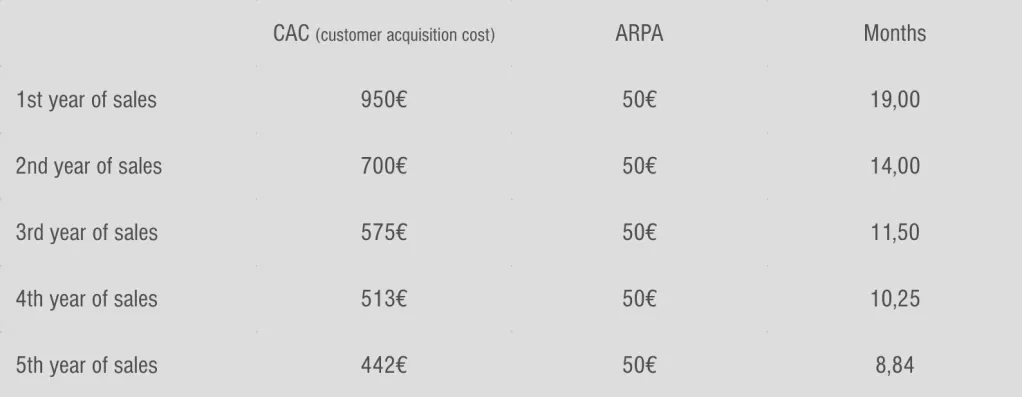
ARPA is the average MRR per account. (MRR - monthly recurring revenue)
It is suggested that the number of months to recover CAC should be less than 12.
SALES EFFICIENCY
Efficiency = (Gross Year Sales / Total Marketing expenses) / Churn Rate
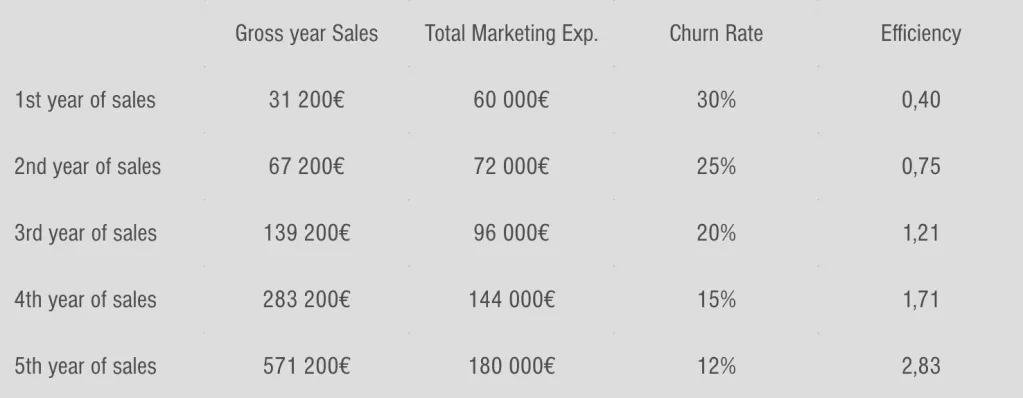
Efficiency = For every dollar spent, how much new revenue does that bring in?
Summary
In a comprehensive five-year analysis, the numbers speak for themselves. The initial two years reflect a negative impact, which is perfectly understandable at the beginning of any business. However, by the third year, all metrics show we are slowly starting to have positive results at this rhythm. The fourth and fifth years reveal a substantial positive impact, showcasing exponential growth. Sales efficiency underscores the growing efficiency and profitability, showcasing the success of the SaaS model over the extended timeline.
I opted for annual calculations, providing a comprehensive and straightforward view; however, monthly or quarterly analyses are more commonly used and accurate. Yet, if your service allows you to expand the range of services to increase the ARPA, this will markedly influence your metrics, amplifying your overall impact. As you know, increasing the value of an existing customer is much cheaper than getting new customers.
These metrics should be strategically placed in your roadmap, acting as guiding indicators to ensure alignment with your business trajectory.
Your insights matter. Feel free to share comments and questions below, contributing to an open dialogue.

Thanks for reading. If you enjoyed our content, you can stay up to date by following us on X, Facebook, and LinkedIn 👋.